Analyzing and Predicting Displacement in Sub-Saharan Africa and Latin America
Ankushi Mitra, Da Sul Kim, Joel Chavez, and Maricarmen Barron Esper
The number of forcibly displaced persons, including refugees, asylum-seekers, and internally-displaced persons, stands at an all-time recorded high of 82.4 million (UNHCR, 2020), with most refugees living in long-term displacement in the global south (UNHCR, 2019). In this project, we analyze the current displacement landscape in two of the world’s biggest refugee-generating and refugee-hosting regions—Sub-Saharan Africa and Latin America—using descriptive, geospatial, and predictive analysis. Our dataset includes data from 70 countries from 1990 to 2020 (n=1,909), with refugee data sourced from UNHCR, conflict data from the UCDP Battle Deaths Dataset and UCDP Deadly Electoral Conflict Database, government index data from Varieties of Democracy (V-Dem), economic data from the World Bank, and natural event data from the International Disasters Database.
Our Github repository can be found here.
Lower Income Countries Display Higher Number of Refugees
The significacntly higher number of refugees coming from lower income countries may inform research efforts that study the causes of displacement. In addition, this preliminary information can point to gaps in resources for countries going through humanitarian crises.

Apart from analyzing quantitative data, it is important to integrate contextual and theoretical research into analyses. Somalia and Sudan are the leading countries in number of refugees between 1990 and 2020 in the Sub-Saharan region. These nations have suffered famine and political conflict, which may influence the number of refugees coming from these countries. Even though we cannot make causal statements about the influence of these factors, they can help us analyze our ML results within the context these events are ocurring.

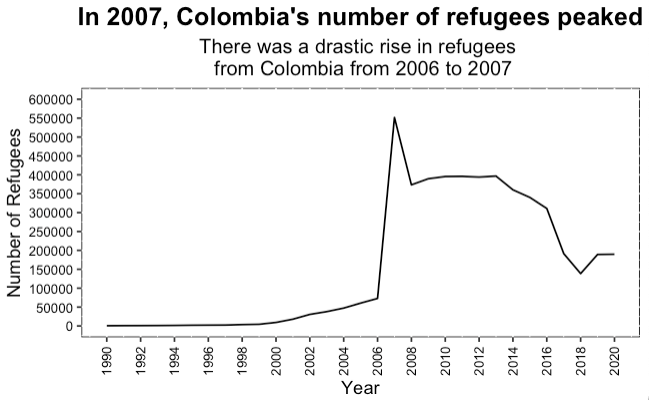
In the Americas, we can observe that Colombia has a significantly higher number of refugees reported in the same period (1990-2020). Colombia’s recent history includes internal conflicts related to drug cartels, politics, and guerrillas. Again, we are not making causal inferences here about the relationship between these events and displacement of people, but considering the context in which these movements of people are happening can help us develop a more holistic model and analysis.

If we take a closer look at Colombia, we can observe that there is a drastic increase in the number of refugees originating from that country from 2006 to 2007. The year 2006 was “a key moment of the Colombian internal conflict, when paramilitaries were demobilized. A number of these paramilitaries participated in judicial trials and confessed to the killing of 161,758 people6… Demobilized paramilitaries also confessed to massacres, threats of violence, targeted killings and forced displacement.” (The Humanitarian Crisis in Colombia Caused by the Armed Conflict 2011).
Visually, there are also higher concentrations of refugees as percent of the total population in Colombia and Somalia as comapred to other countries in Latin America and the Caribbean and Sub-Saharan Africa.

Furthermore, the magnitude of displacement events defined as micro (< 1,000 refugees), small (1,000-10,000 refugees), medium (10,000-100,000 refugees), large (100,000-500,000 refugees), and full-scale (> 500,000 refugees) in countries of origin, can observed below. Machine Learning models could be used to predict where and what magnitude of humanitarian crises may happen, and allow communities to use this information to prepare.

Predicting Displacement By Volume and Category
Organizations involved in refugee response primarily design operational procedures around categories of displacement. The UN High Commission for Refugees, for example, has developed its Refugee Coordination Model with a focus on the scale, location, and duration of displacement, highlighting, in its response criteria, “small, “medium,” and “large” emergencies, short-term and protracted crisis, and encamped and out-of-camp displacement. More recently, due to high volumes of displacement in the Middle East and North Africa (MENA), Horn of Africa, and South Asia, there has also been a growing interest in predicting movements. Scholars like Carammia et al. (2020), Havas et al. (2021), Schutte et al. (2021), and Micevska (2021) have explored machine learning approaches to refugee forecasting, and projects such as UNHCR’s Jetson are seeking to deploy this approach in refugee response operations. In this context, we constructed six machine learning models that attempt to predict (a) refugee movements by category or magnitude using classification methods and (b) refugee movements by volume using regression methods.
Our target variables are: (a) category of displacement, including micro (< 1,000 refugees), small (1,000-10,000 refugees), medium (10,000-100,000 refugees), large (100,000-500,000 refugees), and full-scale (> 500,000 refugees) humanitarian crisis in countries of origin and (b) the number of refugees by countries of origin. We included social, economic, political, and environmental predictors that have been linked to refugee crises in the scholarship and by key organizations like UNHCR and the International Organization for Migration (Castles, 2013; Gemenne, 2015; Van Hear et al., 2018; UNHCR, 2020; Zaman et al., 2020). These include: other categories of displaced populations not legally classified as “refugees” (including asylum-seekers and internally displaced persons); the number of people affected by natural disasters (droughts, earthquakes, floods, epidemics, insect infestations, landslides, storms, tsunamis, wildfires, heat and cold waves, and volcanic activity); indicators related to good governance (presence of local and regional governments, commitment to liberal democracy, distribution of resources, impartial administration, corruption, civil society engagement, freedom of movement, and freedom from forced labor); conflict-related indicators (presence of interstate war, presence of intrastate war, number of battle deaths, election-related violence), and socioeconomic and demographic indicators (inflation, life expectancy, foreign investment, GDP, GDP per capita, GDP per capita growth rate, oil rents, urbanization, and population size). Sources include UNHCR, the UCDP Battle Deaths Dataset, UCDP Deadly Electoral Conflict Database, Varieties of Democracy (V-Dem), and the World Bank.
Our dataset includes data from 70 countries in Sub-Saharan Africa and Latin America—two of the major regions of origin for contemporary global refugee flows (UNHCR, 2020)—from 1990 to 2020 (n=1,909). Missing values were dropped from the dataset before preprocessing and model specification. Due to the relatively small sample size, we used a 90-10 train-test split for our models, along with five-fold cross-validation, to allow for more effective training and evaluation. Feature engineering, including scaling and one-hot encoding, were also conducted for each model in pre-processing using the Tidymodels framework (Nergesian et al., 2017; Zheng and Cesari, 2018).
First, for our regression approach, we used K-nearest neighbors with hyperparameter tuning, random forest, and CART algorithms and specified root mean square error (RMSE) as our metric for comparison across models. We found that our random forest model has the strongest r-squared among the candidate models at 0.75 (compared to 0.36 for KNN and 0.45 for CART), indicating that it is quite good at capturing the variation in our data. Based on RMSE values (98,388 for KNN, 54,698 for random forest, and 87,406 for CART), we confirmed that our random forest model outperformed the alternative approaches. However, with an RMSE of 54,698 refugees, this model does not seem to perform very strongly. Within the context of the data, the mean value of refugees is 47,501, while the median value is only 911, which shows that a majority of displacement across country-years occurs on a relatively small scale. This suggests that our best model tends to overpredict the volume of displacement, which is further confirmed when we consider that our mean absolute error in evaluation was 16,893 refugees in comparison to our RMSE for the random forest model. This pattern is likely linked to the propensity of refugee data to be influenced by outliers and high leverage points during spikes of conflict or natural disaster in certain country-years. For instance, one of the largest observations in our data is Rwanda in 1994-1995, where the volume of refugees spiked to over 2 million during the Rwandan genocide, before subsiding immediately thereafter. It is likely that our best model would improve its performance if we excluded such outliers and high leverage cases. However, because such cases constitute the fundamental reality of how displacement occurs, such an approach may not make much sense in the context of our substantive question.

Second, for our classification approach, we continued to develop K-nearest neighbors with hyperparameter tuning, random forest with hyperparameter tuning, and CART algorithms and specified prediction accuracy as our criteria for analyzing the models in comparison. We found that our random forest model continued to have the strongest accuracy at 0.91 (compared to 0.84 for KNN and 0.75 for CART) in evaluation. While our best regression model is overpredicting specific volumes of displacement, this classification model appears to offer strong insights on the scale of displacement more broadly. Operational guidelines for refugee response are generally designed in this manner due to the rapidly evolving nature of particular displacement events, and such ML-based classification models may thus be a valuable addition to existing approaches for designing refugee response guidelines.